Spot the loss
See where production falls behind.
PRODUCTION INTELLIGENCE FOR MANUFACTURING
Connect live production data, your shift teams and the decisions that move your factory forward.
Live OEE · Downtime · Advanced analytics · Ask Pulse AI
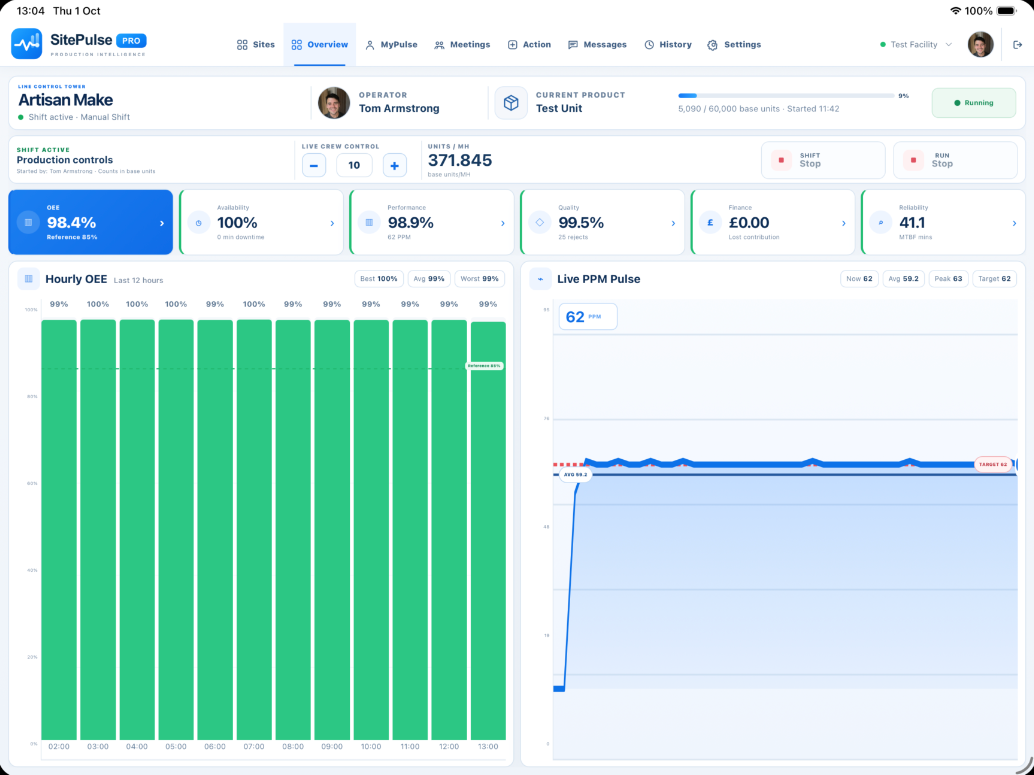
See where production falls behind.
Put a reason behind lost time.
Give improvement actions an owner.
SEE IT. UNDERSTAND IT. ACT ON IT.
Illustrative product view. Example data.
Track speed, output and overall equipment effectiveness against your product targets.
Record planned and unplanned stops, add asset and reason context, and identify repeat problems.
Review hourly trends, run history and shift reports to guide your next improvement conversation.
PEOPLE MAKE THE DIFFERENCE
Keep the context with the work, from an operator’s downtime reason to an engineer’s follow-up action.
On tablets, mobile devices and shared factory displays.
ADVANCED ANALYTICS & ASK PULSE AI
Compare performance, explore downtime and share reports that give your team a clear starting point.
Illustrative analytics. Example data.
Ask in plain language. Pulse helps explain the data available to you and generate reports for review.
“Which downtime reasons cost us the most time this week?”
AI-assisted analysis to support your team’s judgement.
FROM YOUR MACHINES TO YOUR TEAM
Agree lines, products, count points and downtime reasons.
Collect data from supported PLCs and sensors through an on-site edge device.
Configure access, tablets and displays around your shift workflow.
Review results, assign actions and track what changes.
Read-only production data collection. Siemens PLC and OPC UA support, with integration agreed for your installation.
SITE PULSE LTD
Engineering experience.
Practical production intelligence.
SitePulse brings machine data and everyday teamwork together, helping manufacturers understand losses and decide where to focus.
SEE SITEPULSE IN ACTION
Tell us what you make and where you need better visibility.